Pipelines and columntransformer in Sklearn
What is pipeline?
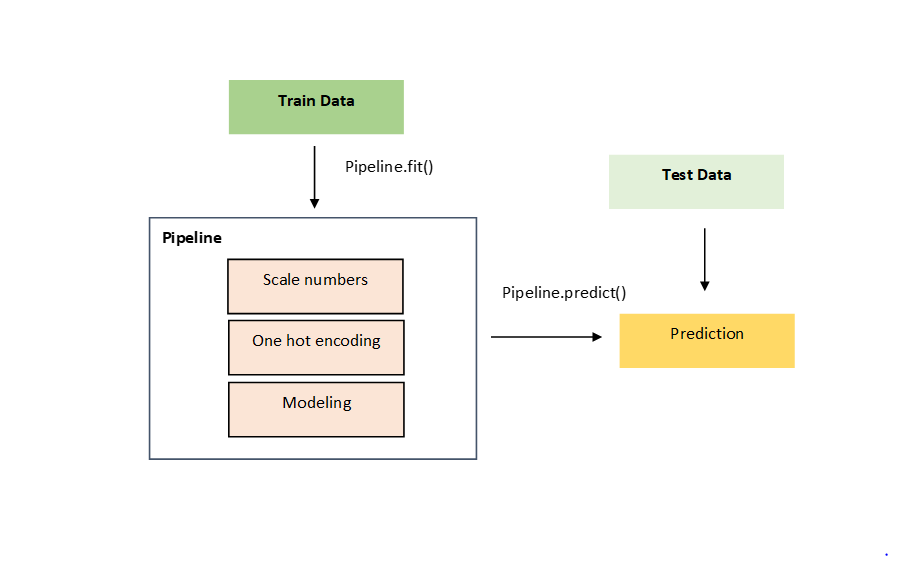
Pipeline is a way to organize repetitive steps in data science projects such as data cleaning, data transformation and data modeling. It makes your code clean, readable and facilitates implementation in the production environment.
It is recently that I came across to combination of columntransofmer & pipeline, and I found them extremely efficient for the ordering & automation of coding. So let's jump in the code to see how we can apply them together.
For this example, I am using Airbnb dataset from kaggle.
First loading essential libraries:
#load libraries
import pandas as pd
import numpy as np

from xgboost import XGBRegressor
from sklearn.tree import DecisionTreeRegressor

from sklearn.model_selection import train_test_split
from sklearn.metrics import mean_absolute_error,mean_squared_error

from sklearn.impute import SimpleImputer
from sklearn.preprocessing import OneHotEncoder

from sklearn.compose import ColumnTransformer
from sklearn.pipeline import Pipeline
Loading the data:
#read data
airbnb = pd.read_csv('data/AB_NYC_2019.csv')
This data is Airbnb New York dataset in 2019 and includes all needed information to find out more about hosts, geographical availability, neighborhood, etc. Each listing is having a price for night, which is our target variable.
airbnb.head()
| id | name | host_id | host_name | neighbourhood_group | neighbourhood | latitude | longitude | room_type | price | minimum_nights | number_of_reviews | last_review | reviews_per_month | calculated_host_listings_count | availability_365 | |
|---|---|---|---|---|---|---|---|---|---|---|---|---|---|---|---|---|
| 0 | 2539 | Clean & quiet apt home by the park | 2787 | John | Brooklyn | Kensington | 40.64749 | -73.97237 | Private room | 149 | 1 | 9 | 2018-10-19 | 0.21 | 6 | 365 |
| 1 | 2595 | Skylit Midtown Castle | 2845 | Jennifer | Manhattan | Midtown | 40.75362 | -73.98377 | Entire home/apt | 225 | 1 | 45 | 2019-05-21 | 0.38 | 2 | 355 |
| 2 | 3647 | THE VILLAGE OF HARLEM....NEW YORK ! | 4632 | Elisabeth | Manhattan | Harlem | 40.80902 | -73.94190 | Private room | 150 | 3 | 0 | NaN | NaN | 1 | 365 |
| 3 | 3831 | Cozy Entire Floor of Brownstone | 4869 | LisaRoxanne | Brooklyn | Clinton Hill | 40.68514 | -73.95976 | Entire home/apt | 89 | 1 | 270 | 2019-07-05 | 4.64 | 1 | 194 |
| 4 | 5022 | Entire Apt: Spacious Studio/Loft by central park | 7192 | Laura | Manhattan | East Harlem | 40.79851 | -73.94399 | Entire home/apt | 80 | 10 | 9 | 2018-11-19 | 0.10 | 1 | 0 |
Just to check if there is any duplication in values & drop unnecessary columns:
airbnb.drop_duplicates(inplace=True)
airbnb.drop(['name','id','host_name','last_review','host_id','neighbourhood'], axis=1, inplace=True)
Specify numeric and categorical variables, this is going to help us for transformation steps:
numeric_features = [cls for cls in airbnb.columns if airbnb[cls].dtype=='float64' or airbnb[cls].dtype=='int64']
print(numeric_features)
cat_features = [cls for cls in airbnb.columns if airbnb[cls].dtype=='object' and airbnb[cls].nunique()<10]
print(cat_features)
['latitude', 'longitude', 'price', 'minimum_nights', 'number_of_reviews', 'reviews_per_month', 'calculated_host_listings_count', 'availability_365']
['neighbourhood_group', 'room_type']
Let's remove the target variable from columns (since I want to apply transformation steps on the columns and don't want to change my target variable).
airbnb.numeric_features.pop(2)
'price'Let's check situation of missing values in my dataset:
airbnb.isnull().sum()
neighbourhood_group                   0
latitude                              0
longitude                             0
room_type                             0
price                                 0
minimum_nights                        0
number_of_reviews                     0
reviews_per_month                 10052
calculated_host_listings_count        0
availability_365                      0
dtype: int64
It seems reviews_per_month includes missing values, let's address them by replacing mean value (of the column) in the null records, so here I am defining an imputer with strategy of replacing mean value for null values:
imputer = SimpleImputer(strategy ='mean', missing_values = np.nan)
For my categorical variable, I define a pipeline which includes Onehot encoding step for conversion of categorical columns:
cat_imputer =  Pipeline(steps=[
    ('onehot', OneHotEncoder(handle_unknown='ignore'))
])
Here I am defining a columntansformer which includes these parameters:
- remainder: By specifying remainder='passthrough', all remaining columns that were not specified in transformers will be automatically passed through.
- transformers: List of tuples specifying the transformer objects to be applied to subsets of the data. In the above lines, I have defined two transformers, one for numerical variables, which is replacing missing values with mean and one for converting categorical variables using one hot encoding. So this is the place to bind both transoformers here.
pre_process = ColumnTransformer( remainder='passthrough',
    transformers=[
        ('num',imputer,numeric_features),
        ('cat',cat_imputer,cat_features)

])
Here, I am defining two models for applying on my data, one is a XGBregressor and the other one is a Decision tree regressor.
XGB_model =  XGBRegressor(n_estimators=1000, learning_rate=0.05,objective = 'reg:squarederror')
DT_model =  DecisionTreeRegressor(max_depth=10)
Let's divide target,training & testing data:
y = airbnb.price
X = airbnb.drop(['price'], axis=1)

X_train, X_test, y_train, y_test = train_test_split(X, y, train_size=0.8, test_size=0.2,
                                                                random_state=0)

X_train.columns
Index(['neighbourhood_group', 'latitude', 'longitude', 'room_type',
       'minimum_nights', 'number_of_reviews', 'reviews_per_month',
       'calculated_host_listings_count', 'availability_365'],
      dtype='object')
Here I am defining two pipelines, the first one includes:
- Preprocessing step
- Modeling step (XGB regressor)
and the second one:
- Preprocessing step (Same as above)
- Modeling step (Decision tree regressor)
pipe_xgb =  Pipeline(steps=[
    ('preprocessor',pre_process),
    ('model',XGB_model)
])

pipe_dt =  Pipeline(steps=[
    ('preprocessor',pre_process),
    ('model',DT_model)
])

pipe_line = [ pipe_xgb, pipe_dt]
mdl_name = ['XGB','Decision Tree']
For each pipeline object, train model using training data & predict test data:
i = 0
for pipe in pipe_line:
    pipe.fit(X_train, y_train)
    predictions = pipe.predict(X_test)
    print("Model is " + mdl_name[i]+", MAE: " + str(np.round(mean_absolute_error(predictions, y_test)))+
      ", RMSE: "+str(np.round(np.sqrt(mean_squared_error(predictions, y_test)),3)))
    i = i+1
Model is XGB, MAE: 67.0, RMSE: 232.755
Model is Decision Tree, MAE: 70.0, RMSE: 294.749
By comparing the MAE & RMSE of outcome, we can see XGB regressor is performing better than the Decision tree. Anyway, the objective of this example was not training the best model for our data, but to show how easy we can automate & order our data modeling steps using pipeline & column transformers.
Good references to check more materials on the topic:
- Sklearn documentation about Pipeline: https://scikit-learn.org/stable/modules/generated/sklearn.pipeline.Pipeline.html
- Sklearn documentation about columnTransformer: https://scikit-learn.org/stable/modules/generated/sklearn.compose.ColumnTransformer.html
- A good notebook about Pipeline in Kaggle: https://www.kaggle.com/alexisbcook/pipelines
- Automate Machine Learning Workflows with Pipelines in Python and scikit-learn: https://machinelearningmastery.com/automate-machine-learning-workflows-pipelines-python-scikit-learn/

